
Wednesday, February 12, 2014
2014 Federal Budget: Underfunded Pension Plans in Canada - A greater opportunity!


Monday, December 9, 2013
Equity pullback may be overdue, but piles of cash on the sidelines should provide downside support.
Regionally, we continue to view the risk ‐reward proposition offered by European equities as
(Portfolio Advisory Group - 2013 Year End - Here's What We're Thinking - Forum) - E
Tuesday, July 30, 2013
The "Great" Rotation into Fixed Income?
I wanted to share a recent article covering Barron's recent round table discussions on Fixed Income and investment trends.
An even greater rotation into fixed income? Quite a thought, as we're constantly being told that the opposite is occuring... But let's look at the bigger picture.
Every day, more than a thousand Canadian boomers turn 65. The trend is expected to continue for the next 17 years. And as they enter into the drawdown period, they're looking for ways to turn their nest eggs into retirement income.
This has resulted in the need to fundamentally shift their asset mixes, Rick Headrick, president of Sun Life Global Investments, told a lunchtime audience at an advisor event recently.
"In 2000, 70% of portfolio holdings were sitting in equities, while only 14% were in the income categories," he says. "Today 44% is allocated to fixed income."
The other major investment trend, he adds, is corporate-class bonds. For non-registered assets, it's a tax-efficient way to draw income out. In fact, last year, the bulk of net flows into corporate class were allocated to fixed income.
So for all the talk of the great rotation into equities, current flows suggest if there's any rotation, it's into fixed income.
"Equity funds have been in net redemption each of the last four years," says Headrick. "Certainly there's been a flight to safety as well, but it's also because of that thirst for yield."
Corporate class' first major advantage is the ability to switch between funds within the structure. If you wanted to trim your Canadian equity weighting, and move more into emerging markets, you could do that within corporate class without triggering a tax event.
Another big advantage: efficient taxable distributions. A corporate mutual fund company can pay out Canadian dividends, which are taxed more favourably than interest income or foreign dividends. Also, on redemption, only 50% of capital gains are taxable.
The structure can cancel out gains and losses for tax purposes. (If you have one fund sitting in a gain position and another in loss, they offset each other.)
But these advantages can come at a cost.
Corporate class fixed-income funds have higher fees relative to the mutual fund trust version. But that's ok because tax efficiencies more than offset those higher fees.
Headrick notes another wrinkle in the form of the disconnect between investors' risk appetite and their return expectations:
"Currently only 22% of investors are willing to take on more risk to get a higher return, yet 40% expect their investments to yield 5% to 7%, he says.
That means the traditional asset mix of fixed income and Canadian equities won't cut it.
"Investors need to diversify into infrastructure (toll roads, airports, etc.), real estate, emerging market debt and other non-traditional asset classes to create sustainable income in retirement," he asserts.
Something that we tend to fully agree with.
Please give me a call/email if you would like to discuss your current asset mix, investment policies, or to review what options in the non-traditional space are available to you.
Best Regards and Safe Investing!
Eric
Tuesday, July 2, 2013
Recent market volatility isn’t necessarily all bad news…
- On June 19, Ben Bernanke and the members of the Federal Open Market Committee (FOMC) signaled the tapering of bond purchases by the U.S. Federal Reserve.
- The statement triggered the biggest two‐day decline in stocks in the last few years. However, in our view, the tapering of bond purchase means that the economy is improving. If the economy is improving then that will be good for corporate earnings and therefore good for stocks and commodities, and bad for bonds and gold.
- We believe the correction we have been expecting is currently underway and this will soon represent a good buying opportunity. We remain optimistic on the outlook for equities, continuing to prefer the U.S. over Canada for the balance of 2013.
- The increase in bonds yields after the June 19 FOMC statement was no surprise as one of the largest buyer of bonds since the recession has just signaled their intentions to slow down the purchases and possibly end the purchases in 2014. With increased borrowing costs due to higher interest rates, the cost of borrowing is outweighing the benefits of holding stock positions with borrowed money and therefore funds that buy stocks with borrowed money decided to sell their stock positions and payback their loans.
- Global equity markets have been declining since Fed Chairman Bernanke’s testimony to Congress on May 22. In this testimony, Bernanke made it clear that the FOMC “is prepared to increase or reduce the pace of its asset purchases to ensure that the stance of monetary policy remains appropriate as the outlook for the labor market or inflation changes.” This 1‐2‐3 punch triggered sharp declines in virtually every asset class, except the U.S. dollar.
- Broadly speaking, improving economic trends bode well for corporate earnings growth, and with valuation still attractive, U.S. equities remain our favourite asset class. In this environment, our preferred U.S. sectors remain Financials, Industrials, Technology, and Healthcare. We expect some additional softness for Telcos, Utilities, REITs, and Consumer Staples.
- Gold has succumbed to the fact that inflation around the world remains subdued and that the U.S. could soon stop “printing money.” Copper and other base metals are flirting with technical support levels as investors re-evaluate China’s economic growth.
- Recent U.S. economic data has been mixed but still supportive of an improving trend. Retail sales for May, which provide tangible evidence of improving consumer confidence, were better than expected. In sharp contrast to the U.S., Canadian April retail sales were weak and declined when auto sales are excluded. Headline inflation for May was also lower than expected.
- After weak trade data earlier this month, Chinese manufacturing activity showed further contraction. Based on recent commentary from the new leadership it appears that they are comfortable with the current level of economic growth (7%‐8%). Furthermore, the new leadership has voiced a preference to move the country toward a sustainable growth model by focusing on financial, social, and environmental reforms, and a gradual transition away from an export‐centric economy to a domestic‐centric economy.
Thursday, June 20, 2013
Risk on / Risk off...........

I wanted to share some of our Chief Investment Officer's comments regarding the current market reaction to the above:
E
"Since WW2, investors have endured a total of 56 pullbacks, 19 corrections and 12 Bear Markets." (S&P Capital)
Wednesday, June 12, 2013
Selling Your Business? Planning is key........
In many cases, the owner of a small business wants to pass the business on to succeeding generations, typically children. This can be done through a Will when the person dies but the person may want to do this while they are still alive. There can be compelling tax reasons to do this. An 'estate freeze' is a mechanism where ownership passes to the next generation while the owner is still alive. Here are the different types of estate freezes:
Paying Tax Now
Under tax law, if an asset such as a company is transferred to another party, either to family member(s) or another arm's length party, it is considered to be a sale at the fair market value. This can result in substantial capital gains tax in the year of the transfer if the company has increased in value. However, if you transfer now, any subsequent growth is attributed to the new owners.
Use of Trusts
One way to do an estate freeze is to have the shares of a company transferred into a trust with family members as the beneficiaries. You may be able to establish yourself as the trustee and retain control but if the beneficiary of the trust is not your spouse, you will have to pay capital gains tax since the transfer will be as if you sold the shares. Again, tax on any subsequent growth in the shares is the responsibility of the trust and/or the beneficiary.
Section 85 Rollover
In the previous two examples, there may be immediate tax implications by transferring a company to your family now. A further issue that can arise is that the owner will lose control of the company. The Income Tax Act provides a mechanism that allows an effective change of ownership while still enabling the original owner to maintain control of the corporation. This is the Section 85 rollover.
The Section 85 rollover can be a very practical and tax efficient strategy. However, it can also be rather complex in the details and is another area where professional advice is highly recommended.
Situation:
Lori Strong wants to pass her wholly owned company, Lori Inc. to her two children, Sarah 34, and Chris 32. Her shares of the company have a cost of $1 million. A qualified business valuator has determined the current fair market value to be $5 million so the shares have increased in value by $4 million.
Setting up a Holding Company
A Holding Company, Holdco Inc, is set up. Sarah and Chris are equal shareholders and they each buy 100 common shares for $1 per share.
Using Section 85, the shares of Lori Inc, are transferred into Holdco. In return Lori receives preferred shares of Holdco worth $5 million, the fair market value of the Lori Inc. shares. These preferred shares have voting control over Holdco and are retractable at Lori's discretion, which means she can redeem them for $5 million. Lori can choose a transfer value for the shares of $1 million - her cost. Lori will not have to pay any tax on the preferred shares until she eventually sells them.
Since the preferred shares have a set value of $5 million any subsequent increase in the value of the Lori Inc. shares will accrue to the two common shareholders of Holdco Inc., Sarah and Chris.
By doing this, Lori has managed to keep control of the company, deferred any immediate gain, and has passed on any subsequent growth to her children.
One of the important features of the Section 85 rollover is that Lori will have discretion in regards to the transfer value of the Lori Inc. shares. For example, although the shares currently have a fair market value of $5 million, under Section 85 she may be able to transfer the shares at their cost of $1 million, avoiding any immediate tax since the transfer amount chosen ($1 million) is the same as her cost. The children would have a tax cost of $1 million for the assets (the shares transferred) and the owners of Holdco Inc. shares (Chris and Sarah) will not have to pay any tax until they dispose of the Lori Inc. shares in the future.
Your advisor will be able to provide you with additional general information on Section 85 rollovers and how to proceed if it appears that this strategy would be right for you.
Be sure to update any other documentation that may contain information related to your company, such as the information contained in this personal record keeper and personal and financial log book. Share your personal record keeper with your loved ones including your Executor or Executrix. Provide a copy of your personal and financial log book to your financial advisor so that he/she can have a better understanding on how your financial situation is changing.
Once a month I will be putting up key articles on Business Succession Planning in preparation for our fall series of luncheons on the subject.
*Please forward this on to anyone you know who may be going through the motions of selling or succeeding their businesses in the coming years. (*Early planning is key.)
Or, if you have any questions, or if you would like to meet personally to have a discussion, shoot me a message.
Best Regards.
Eric
Wednesday, March 27, 2013
Private/Public Capital Trends in Oil and Gas...

"A Privileged Trough of Capital Reflects Change"
They say, "you can lead a horse to water, but you can't make it drink."
There are exceptions to this proverb, notably for oil a nd gas companies. We know if you lead them to capital they will always drink. Unless the trough is dry.
Right now there is unprecedented scarcity of public capital available for oil and gas companies. Year to date Canadian financings for the industry are at a 10-year low, and probably at an all time low if the data is adjusted to reflect a growth metric, for example dollars available per unit of output. The dearth of dollars is, in part, due to the mood of the capital markets, but mostly the situation speaks to the changing structure of the industry.
After flipping the 2013 monthly calendar twice, year over year public company financings to date are tracking around 20% of normal. As of early March, total equity raised is at $345 million, which is a mere trickle. Usually by this time of year new equity issues are indicating one and a half to $2 billion, well on the way to the 10-year average of about $10 billion per year. Debt too is lagging: only $275 million has been issued this year.
It's not unheard of for the debt and equity spigots to be shut. It happened in 2002 after Enron imploded. IT also happened on rare occasion in the 1990s, but back then the industry was one-fifth the size that it is now on a cash flow basis. Also, since then, acute inflation in the mid-2000s devalued the purchasing power of an investment dollar.
Today the capital markets are demonstrating extreme discretion. ALthought broad equities have perked up recently, risk aversion is still top of mind among investors. IN Canada, intertwined macro oil and gas issues like price differentials, low prices and access to markets are also causing reticence to finance public companies in the industry.
WHile debt and equity are important lifelines, the dominant source of investment capital is cash flow. Unless dividends are being paid out, oil and gas companies typically reinvest every dollar of cash flow back into the ground. But on the natural gas side of the business this source of capital is also scarce due to low continental commodity prices. On the oil side, cash flow is compromised due to deep price discounts. Historically, this three-way choking off of industry capital - equity, debt and cash flow - would reflect negatively on the industry, leading to a serious contraction of field activity and ultimately production declines.
Drilling activity is somewhat muted this year, but not proportionally to the dearth of public capital. Our estimates suggest that the industry will still spend $54 billion in 2013, this despite a forecast of only $36 billion from cash flow. How is this reconcilable; in other words, how can the industry as a whole be spending 1.5 times its cash flow without help from public capital markets?
The gap is explainable by prevailing structural changes. First, private equity capital has stepped in to fill in for some of the public market shortfall, but not all. Globally, the institutional investors bias is leaning toward private company investment. Private equity has financed several hundred million dollars already in 2013, but this quieter source of capital is highly selective and doesn't serve up growth capital to the broader industry.
Selectivity and discretion is a big theme in today's investment landscape. Only a handful of high-growth, darling companies are able to raise money; for example, two-thirds of the $345 million in equity this year was raised by one public company - Tourmaline OIl Corporation.
The loudest statement about structural change comes from the patient and deep pockets of large multi-national companies, there the bulk of the industry's growth capital is coming from right now. None of these participants need to depend on public market financings to further their interests. Shell, Chevron and PETRONAS are declared long-term players in the LNG game, spending money from wellheads to the coast, regardless of current market conditions. Overseas JV money targeting resource plays also continues to be an alternative source of capital. Notable, big oil sands companies are tracking spending levels in the low-$20 billion level this year, with no hiccup relative to prior years.
Massive up front investment into big resource development is how the industry will end up spending significantly more than its cash flow this year; the oil sands sector will spend 250% more than it takes in, and non-oilsands 120%, for a weighted average of 150% as a whole.
Structurally, the selectivity of capital and shift in its sources means that the oil and gas industry has become a cloistered business that favors few. In fact, there is lots of water at the trough. But for now only big, sophisticated or privileged horses are able to drink. ( Peter Tertzakian - March 22, 2013 - Arc Financial Corp.)
Friday, February 22, 2013

Friday, February 1, 2013
Potential Headwinds!!? Caution in the wind for 2013.....

Back in the saddle!
It's been a while since my last post... But with the market rally we've been experiencing I felt it prudent to share some cautionary thoughts as we head into 2013.
Starting with a great article I received from our friends at Bloomberg which details some key factors that have been fueling the rally and why we may want to proceed with caution from this point:
The US stock market rally that kicked off the New Year continued last week, and after only two weeks, US stocks are up around 3% for the year. European stocks have posted similar gains and equities in Japan have advanced even further. What’s behind this rally – and more importantly, can it continue?
In my view, the rally can be attributed to three factors. The first is obviously relief over the fiscal cliff deal. Also, some investors sold winning investments in December in an attempt to generate capital gains in 2012 before capital gains taxes in the U.S. were scheduled to increase in 2013. Because capital gains rates did not change for most Americans, however, many investors are now buying back the stocks they had sold.
Second, stocks are benefiting from a normal period of seasonal strength. While the so-called “January effect” may not be as significant a trend as some would believe, there is a modest historical tendency for stocks to advance in the first month of the year.
Finally, economic data has generally been better than expected, not just in the United States, but also globally. Manufacturing data from China is confirming that an economic hard landing has been avoided and there are also some similarly positive signs from the US financial services sector. The global economy is starting 2013 with some momentum.
But it is important to remember that at least the first two of these factors are likely to be temporary. True, I expect equity markets to continue to advance and to outperform bonds for the year as a whole, with the best performance likely coming in emerging markets. But I believe the current pace of gains will slow—if not immediately, then probably by February. Here are three reasons why I remain cautious in the near term:
1. Expect a good deal of headline risk coming in the next couple of months. Investors should expect continued dysfunction from Washington as lawmakers wrestle with the debt ceiling, scheduled spending cuts and the need for continuing budget resolutions. Not only are the odds of some sort of “grand bargain” diminishing, but the current bickering raises the possibility of another last-minute showdown and a potential debt downgrade.
2. There is political risk coming out of Europe, with Italian elections approaching in February. Should the election fail to produce a clear result, or should the voters choose a less market-friendly government than the one currently headed by Prime Minister Mario Monti, markets would likely react negatively.
3. There are lingering concerns about the US economy. Once we get a look at January month-end data, we will see the first clues about how higher taxes are impacting the economy. Notwithstanding some of the stronger data cited earlier, I expect the first quarter to show relatively soft economic data. In particular, I’m concerned about consumption levels weakening in January as people come to grips with smaller paychecks.
Moreover, while these risks are clearly evident, investors seem to be overly complacent. The VI X Index (a widely followed measure of stock market volatility that is also known as the “fear index”), fell last week to its lowest level since June 2007, suggesting that there is not much bad news priced into market right now. That means any negative shock would have the potential to drive markets lower.
The bottom line is that while stocks are reasonably valued (particularly outside the United States), expect tougher going as we head into February. Source: Bloomberg, L.P.
Best Regards and Safe Investing!
E
Saturday, September 15, 2012
September (make it) Rain... (kinda sounds like a G&R song)
My friend over at Qwest Investment Management had a terrific "trend watch" report out last week. The following utilizes some excerpts from this letter which I think hit the nail on the head for the economic environment we are in...
September is turning out to be “stimulus month” for the global economy. First, the European Central Bank announced a program of unlimited buying of peripheral country debt under certain conditions. Their actions have temporarily put a floor on eurozone risk.
China followed by announcing a series of infrastructure spending initiatives designed to stimulate the economy. Measures include plans to build 2,018 kilometers of railroads, as well as spending on sewage treatment plants, port and warehouse projects and waterway upgrades.
And then last week the Federal Reserve joined the party by announcing further stimulus for the American economy.
Stock and commodity prices have soared on news of these pump priming measures. While our Trend Model was prescient enough to spot this rally early, we believe that this is a rally to be “rented and not owned”. Longer term problems remain and the global economy still has to deal with the longer term problem of a debt overhang, which ultimately translates to slower economic growth.
They went on to utilize a chart from HS Dent Research which adds to the the story. It demonstrated the correlation of US age demographics to stock market returns. Baby Boomers are nearing retirement and until the next generation, who are aptly named the Echo Boomers, start to hit their peak savings years, stock prices will continue to face some real headwinds. (I haven't included the chart in this blog entry, but instead have added a great chart showing the "expansion and contraction" cycles in the markets (Dow Jones back to 1900). One can easily spot the population "boomers" cycle from start to current retirement.)

Wednesday, July 18, 2012
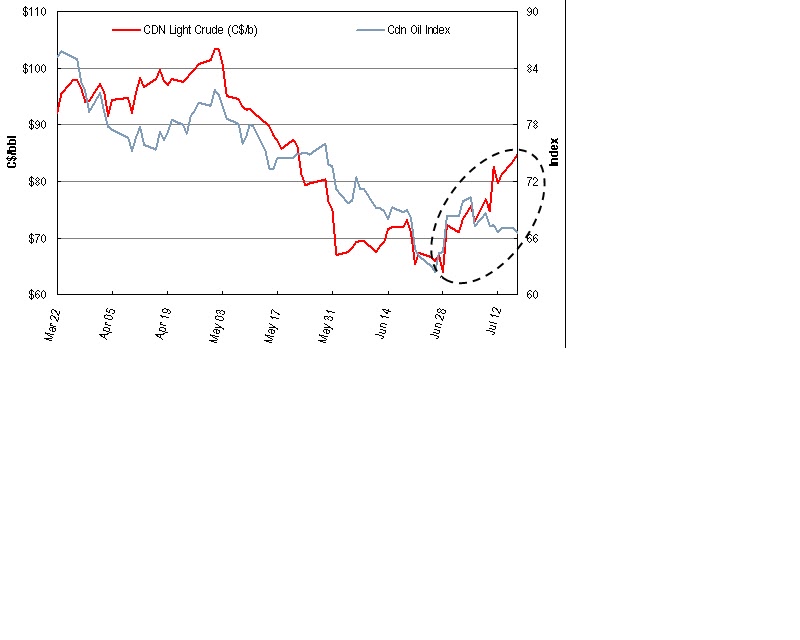
Realized Canadian light crude prices have improved significantly; will the equities follow?
The WTI price has strengthened in recent weeks but there have been wider CDN price differentials periodically throughout 2012 which have negatively impacted Canadian wellhead prices. We note that the light differentials have narrowed substantially in the last couple weeks results in significantly higher realized oil prices for producers.
· The graph shows that the Canadian light Sweet Price (Net Energy) was trading at a of discount to WTI of $11.50/b or a CDN realized price of ~$65.00/b in late June.
· The discount in the couple weeks has narrowed significantly from $11.50/b to only $1.00 - $3.25/b currently. This narrowing combined with the improvement in WTI has significantly improved the realized price in Canada. The implied CDN light price as of last night was ~$85.00/b a $20.00/b improvement in the last 2.5 weeks.
· This trend is also seen in other light crude products. For example, Bakken crude at Clearbrook MN has increased from US$63.69/b on June 28th to ~US$88.50/b this morning.

· No surprise but there is a strong correlation between the light crude price and oil weighted producers in our coverage universe. We have included a graph going back from March which shows that the two often move in lock step (corr. of 85%)
E
Wednesday, March 21, 2012

Tuesday, March 20, 2012
The Search for Yield - Dividends & Payout Ratios

In an era of historically low bond yields and zero percent benchmark interest rates,
the thirst for income has rarely been so hard to quench. Since 2009, the yield on 3-
month Treasury Bills has averaged 0.65% in Canada and 0.10% in the United
States. From 1954 to 2007, U.S. 3-month yields averaged 5.2%. Investors have
been fleeing pure equity investment vehicles for years and flocking to income
products/bond mutual funds in search of income and lower volatility. The latter is
likely to prove elusive in coming years as monetary policy normalizes higher. The
traditional high dividend paying sectors such as Utilities, Telecom, and REITs have
benefitted the most from income oriented flows in recent years, but other areas of
the market may now attract some attention. U.S. Banks that have cleared stresstests
will start raising dividends and Technology behemoth Apple announced
yesterday that it would re-introduce a dividend. The S&P 500 dividend currently
stands at US$27.53 and its dividend yield of 1.95% had until recently surpassed the
U.S. 10-Yr bond (2.38% yesterday, 1.88% last 3M average). In Canada, the TSX's
dividend yield (2.85%) still edges 10-Yr Canada bonds (2.29%). Both for the TSX
and S&P 500, a positive dividend yield-to-bond yield spread is a first since late
2008-early 2009. Dividend growth has lagged the profit recovery since 2009 and
the S&P 500's payout ratio of 28% is the lowest since 1871. Equity flows could see
a positive reversal if bond returns start to disappoint. Should this happen, we
believe companies offering high yields and the ability to raise dividends will benefit.
Non-traditional dividend areas are likely to join the dividend party as well. Our Chart
of the Day highlights the S&P 500 and TSX index/sector dividend yield and payout.
Thursday, February 16, 2012
Strategy Corner....Dividends and Share Buy Backs. (It's been a while)
Dividends and Share Buybacks
Over the years, companies have created shareholder value through share repurchase programs and/or dividend increases. By share repurchase program we are referring to companies that buy back their stock in the open market. Both policies can create value for shareholders although there is an ongoing debate as to how much value is created, and which is the better use of free cash flow.
Certainly, the permanence of a dividend increase tends to be a better indicator of financial health and investors like to see dividends credited to their accounts. That said the return of cash to shareholders through share repurchase programs also benefits shareholders by reducing the number of shares outstanding, boosting earnings per share, and providing support for the share price. In this report, we have attempted to identify companies that have a history of consistently delivering on both shareholder friendly policies.
U.S. Corporations Flush with Cash
U.S corporations are sitting on record levels of cash with non-financial corporate businesses holding U$2.12 trillion in liquid assets at the end of the third quarter of 2011. High free cash flow yields combined with low returns generated on cash holdings should lead to increased dividend payments to shareholders and share buyback activity. In 2011, S&P 500 companies paid U$256 billion in dividends to shareholders, or about 29% of earnings. That’s well below the long-term average payout ratio of 47%. In 2011, U$530 billion worth of share buybacks were also authorized, up nearly 45% from 2010.
16 Companies with Investors’ Interests in Mind
We screened the S&P 100 Index of U.S. mega cap stocks, looking for companies that consistently repurchased shares and increased dividends over the past five years. To qualify, a company must have repurchased and reduced its common shares outstanding, and increased its dividend in each of the last five years without exception.
When creating our list, why did we not simply look for cash-rich companies with high free cash flow yields? Far too many management teams have destroyed shareholder value with poor investment decisions. Share buybacks and dividends put cash directly back into shareholders hands. However, these shareholder friendly policies should not come at the expense of strategic investments that could positively impact a company’s long-term growth and financial health.
There are 16 companies in the S&P 100 that met our selection criteria. Industrials, in particular defense companies, large retailers, and health care companies dominate the list. The stocks on the following page are ranked based on yield, decline in shares outstanding, and growth rate in dividends. On the basis of these three equally-weighted factors, Lockheed Martin (LMT) tops the list. On average, over the last five years, this defense company has reduced its shares outstanding by 5.3% per year while increasing its dividend annually by an impressive 21%. The shares currently yield 4.8%. Runner-up Texas Instruments (TXN) repurchased a similar amount of shares, but its Board was more aggressive in terms of annual dividend increases. However, the chipmaker’s shares yield only 2.1% at their recent quotation.
*Call or send me an email to discuss the companies that passed the test, and how this strategy may be a possible addition to your current investment policy.
Best Regards and Safe Investing!
E
Thursday, December 15, 2011
Upcoming Seminars:
 WHY?
WHY?Reduce your financial burden.
Maintain your independence.
Access cutting-edge medical services.
Assist in your recovery any way you choose.
Wednesday, November 23, 2011
Strategy Time... (a revisit to high yield corp bonds)
 High yield bonds offer investors attractive income in the current environment, with an average yield of more than 600 basis points greater than the yield on government bonds.
So, why is it important for investors to include an allocation to high yield bonds in their portfolio?
1. Enhanced Diversification - High yield bonds are often considered a distinct asset class, as they involve different return characteristics and have a lower correlation to traditional asset classes such as Government bonds and equity. For this reason, adding high yield bonds can increase portfolio diversification, and potentially reduce risk and enhance returns.
2. Attractive Income Potential - With interest rates at low levels, most investors cannot generate the income they require by investing in government bonds alone. Generally speaking, high yield bonds pay higher interest rates than investment-grade and government bonds to help compensate investors for the additional risks of investing in lower quality bonds. Over the life of a bond, those higher coupons provide a higher rate of return than higher quality (investment grade) bonds.
High yield bonds offer investors attractive income in the current environment, with an average yield of more than 600 basis points greater than the yield on government bonds.
3. Capital Growth Potential - In a recovering economy, companies who issue high yield bonds can see their debt rating upgraded due to improved cash flow, offering investors the potential for capital appreciation from the associated increase in the bond’s price. Historically, high yield bonds have tended to provide equity-like returns, but with much lower volatility – a characteristic that many investors are currently looking for.
4. Less Sensitivity to Interest Rates - High yield bonds tend to be less sensitive to interest rate fluctuations than most fixed income securities, primarily because they carry a higher coupon and have terms of 10 years or less. In addition, high yield bond prices react more to credit spreads and changes in credit quality than interest rates.

We believe conditions remain extremely favorable for high yield bonds. Weak demand, particularly from consumers is providing an environment of slow but positive economic growth, low interest rates and low inflation. Corporations, having cut costs and delevered balance sheets during the credit crisis, are showing strong profit growth but only marginal revenue growth. As a result, leverage across the corporate sector remains low, and cash has been building to record levels. Credit quality, as measured by balance sheet strength is at record levels and corporate default rates are headed towards new lows.
With yields on traditional income producing investments at record lows, investors are increasingly looking to high yield bonds to provide steady, sustainable cash flows. In addition, many investors have been unnerved by the extreme volatility of equities in recent years, with high yield bonds offering an attractive, less volatile alternative. As a result, flows into the sector from both institutional and retail investors continue to grow, putting downward pressure on spreads.
How are we incorporating them in our client’s portfolios? (A study)
All portfolios reflect the clients individual risk tolerances, goals and requirements, so we sit with each and build out a strategy on a case-by-case basis. However, from a macro view, parts of client’s portfolios that are focused around a 100% equity mandate have benefitted greatly from scaling back (say 25%) and reallocating to High Yield.
The chart below shows the 15 year return of the S&P 500 along with the 15 year return on the US High Yield Index. Interestingly, High Yield outperformed by over 8%, but with substantially less volatility during that period.

How does one best invest in this asset class?
It is important to view High Yield Corporate Bonds in a similar risk category as equities. (I commonly refer to them as a “stock in bonds clothing”.) So, I do not look to include them in the Fixed Income portion of client’s portfolio profiles, but rather towards the overall equity portion.
There are a number of ways to participate in High Yield: directly buying the bonds from the issuer, buying the index through various ETFs, or buying units of a High Yield fund. All 3 are great ways, but are unique and dependant on the requirements of the client. **Questions such as Cost, Liquidity, Diversity (market and sector), and Manager Risk are all part of the decision process.
Here are some examples:
iShares IBOXX Hi Yield Index ETF (HYG)
Costs 0.5% MER
The 3 year return 9.36%
The 3 year index return was 10.41%
Small tracking error for this ETF
Current Yield: 8.17%
Marret High Yield Fund (MHY.UN)
Barry Allen – Fund Manager
Costs 1% MER
Average duration – 3 yrs.
Since inception (June 2009) return 10.51%
Current Yield: 7.34%
The High Yield market in Canada is quite small, with most new issue allocations going towards the institutional investor, so looking towards a managed or indexing approach would provide access to much broader markets for the individual investor.
As always, contact your investment advisor to see if this asset class is an appropriate fit in your current portfolio.
Best Regards and Safe Investing.
Eric.
Monday, November 7, 2011
Market Update.... Emphasis on the Pro's not the Con's

It's been entirely too long to go without an entry to my blog. Albeit, my weekly Market Watch newsletter has refocused my attention, it is now time to place some very serious thoughts into perspective.
I've lost all craving for houmous, grape leaves and spanikopita. Probably for ever...
Here's a summary of the expected Euro plan for Greece:
1. Greek bondholders will “voluntarily” write down the value of Greek debt by 50% which will help reduce Greece’s debt load from 150% of GDP down to 120% by 2020.
2. The European Financial Stability Fund (EFSF) will be expanded to 1 trillion euros from the current 440 billion euros through a combination of additional funding from the IMF and possibly a capital injection by China and/or other nations.
3. European banks will be recapitalized to offset the impact of the haircut on Greek bonds.
As encouraging as this European agreement is in principle, it is clearly just the first step in a multi-step program to resolve the European debt crisis.
Despite the significant stock market rally, equities remain the favoured asset class versus bonds. That said, we expect equity market volatility to continue and recommend profit taking to lock in recent short term gains. For buyers building longer term portfolio positions, we expect the market will provide yet another lower entry point so there is no rush to buy at current levels.
One of a few exceptions would be gold which has pulled back almost US$200/oz. since the highs reached in August. Both gold bullion and gold equities should perform well in the current environment.
Commodity cyclicals and industrial stocks offer the most upside potential in the event equities rally again, but they also will likely continue to exhibit the greatest volatility.
Many high quality dividend paying stocks at current levels do not offer much capital appreciation potential but will provide investors with the most downside protection if the market retreats, and the steady dividend income generated remains an important component in portfolio total returns.
Given our outlook for an extended period of slow economic growth, whether falling into outright recession in North America or not, equities are expected to trade in a range for the next several years. We are inclined to trim some profits on holdings that have performed well. In turn, emphasizing the need to be more tactical in the current environment, this capital could be selectively rotated into stable names that are more reasonably valued.
We place particular emphasis on the word "selectively" given the fragile situation in Europe and we continue to encourage a focus on larger-cap companies with sound balance sheets.
Stick to your knitting....
There are indications of a Bullish time for equities ahead.... Why?
1. Systematic/mechanical devaluation of the US$
*Global Commodites/Resources priced in USD.
*Forecasting of some substantial falls in commodity prices over the next few years.
*Which will lower Inflation pressures in global Markets.
(I.e. A $10 fall in the price of a barrel of oil would transfer an amount of income equivalent to around 0.5% of world GDP from producers to consumers.)
*Eventually drive resurgence of demand.
*Good for Canadian resource heavy economy which some argue could overheat and (as we've seen in the past) fail to diversify.
2. The death of Defined Benefit Pension Plans.
*Larger institutional money must be reallocated away from risk-free assets towards stronger blue-chip portfolios.
*Equities will benefit from this "refocus" by pension plans and other large institutional players.
The key of course will be to find ways to continue to navigate the turbulent waters ahead. It is paramount that we tailor our investment policies to reduce volatility and ensure a certain margin of safety is built in, should the macro-economic environment take a turn for the worse.
Thursday, September 15, 2011
How interesting... All out sector correlation (again)
 The S&P 500 sector correlation is at its highest level since '89.
ETFs account for more than 30% of volume in U.S. stock markets, compared with just 2% in 2000. It may be reasonable to expect ETF trading to drive correlation higher because many of the vehicles are tied to stock indexes.
For example, the 10 different industry sectors of the S&P 500 show well over a 95% correlation over the last month, and a low of 72% in February 2011. High yield bond prices are at a 93% correlation to stocks, which is another multiyear record.
This is unusual for U.S. equity markets, which have tended towards lower correlations in rising markets and clustered returns when things get ugly.
It may not mean that we are necessarily in for tougher markets from these points, but it does make the decision about asset allocation more important than sector or stock selection. (At least for the time being)
Best Regards and Safe Investing.
E