
Friday, February 22, 2013


Friday, February 1, 2013
Potential Headwinds!!? Caution in the wind for 2013.....

Back in the saddle!
It's been a while since my last post... But with the market rally we've been experiencing I felt it prudent to share some cautionary thoughts as we head into 2013.
Starting with a great article I received from our friends at Bloomberg which details some key factors that have been fueling the rally and why we may want to proceed with caution from this point:
The US stock market rally that kicked off the New Year continued last week, and after only two weeks, US stocks are up around 3% for the year. European stocks have posted similar gains and equities in Japan have advanced even further. What’s behind this rally – and more importantly, can it continue?
In my view, the rally can be attributed to three factors. The first is obviously relief over the fiscal cliff deal. Also, some investors sold winning investments in December in an attempt to generate capital gains in 2012 before capital gains taxes in the U.S. were scheduled to increase in 2013. Because capital gains rates did not change for most Americans, however, many investors are now buying back the stocks they had sold.
Second, stocks are benefiting from a normal period of seasonal strength. While the so-called “January effect” may not be as significant a trend as some would believe, there is a modest historical tendency for stocks to advance in the first month of the year.
Finally, economic data has generally been better than expected, not just in the United States, but also globally. Manufacturing data from China is confirming that an economic hard landing has been avoided and there are also some similarly positive signs from the US financial services sector. The global economy is starting 2013 with some momentum.
But it is important to remember that at least the first two of these factors are likely to be temporary. True, I expect equity markets to continue to advance and to outperform bonds for the year as a whole, with the best performance likely coming in emerging markets. But I believe the current pace of gains will slow—if not immediately, then probably by February. Here are three reasons why I remain cautious in the near term:
1. Expect a good deal of headline risk coming in the next couple of months. Investors should expect continued dysfunction from Washington as lawmakers wrestle with the debt ceiling, scheduled spending cuts and the need for continuing budget resolutions. Not only are the odds of some sort of “grand bargain” diminishing, but the current bickering raises the possibility of another last-minute showdown and a potential debt downgrade.
2. There is political risk coming out of Europe, with Italian elections approaching in February. Should the election fail to produce a clear result, or should the voters choose a less market-friendly government than the one currently headed by Prime Minister Mario Monti, markets would likely react negatively.
3. There are lingering concerns about the US economy. Once we get a look at January month-end data, we will see the first clues about how higher taxes are impacting the economy. Notwithstanding some of the stronger data cited earlier, I expect the first quarter to show relatively soft economic data. In particular, I’m concerned about consumption levels weakening in January as people come to grips with smaller paychecks.
Moreover, while these risks are clearly evident, investors seem to be overly complacent. The VI X Index (a widely followed measure of stock market volatility that is also known as the “fear index”), fell last week to its lowest level since June 2007, suggesting that there is not much bad news priced into market right now. That means any negative shock would have the potential to drive markets lower.
The bottom line is that while stocks are reasonably valued (particularly outside the United States), expect tougher going as we head into February. Source: Bloomberg, L.P.
Best Regards and Safe Investing!
E
Saturday, September 15, 2012
September (make it) Rain... (kinda sounds like a G&R song)
So here we are, half way through September, and the markets continue to show us that we like the feeling of quantitative easing... So much so, that all other equity indexes are showing the immensely positive shock these programs have on our psychological beings. So away we rally....
My friend over at Qwest Investment Management had a terrific "trend watch" report out last week. The following utilizes some excerpts from this letter which I think hit the nail on the head for the economic environment we are in...
September is turning out to be “stimulus month” for the global economy. First, the European Central Bank announced a program of unlimited buying of peripheral country debt under certain conditions. Their actions have temporarily put a floor on eurozone risk.
China followed by announcing a series of infrastructure spending initiatives designed to stimulate the economy. Measures include plans to build 2,018 kilometers of railroads, as well as spending on sewage treatment plants, port and warehouse projects and waterway upgrades.
And then last week the Federal Reserve joined the party by announcing further stimulus for the American economy.
Stock and commodity prices have soared on news of these pump priming measures. While our Trend Model was prescient enough to spot this rally early, we believe that this is a rally to be “rented and not owned”. Longer term problems remain and the global economy still has to deal with the longer term problem of a debt overhang, which ultimately translates to slower economic growth.
They went on to utilize a chart from HS Dent Research which adds to the the story. It demonstrated the correlation of US age demographics to stock market returns. Baby Boomers are nearing retirement and until the next generation, who are aptly named the Echo Boomers, start to hit their peak savings years, stock prices will continue to face some real headwinds. (I haven't included the chart in this blog entry, but instead have added a great chart showing the "expansion and contraction" cycles in the markets (Dow Jones back to 1900). One can easily spot the population "boomers" cycle from start to current retirement.)

As this rally continues, look for opportunities to take profits off the table and reallocate towards uncorrelated asset classes. - For many of us who have been holding throughout the cycle, this may prove an excellent time to do so. Best Regards and Safe Investing! E
My friend over at Qwest Investment Management had a terrific "trend watch" report out last week. The following utilizes some excerpts from this letter which I think hit the nail on the head for the economic environment we are in...
September is turning out to be “stimulus month” for the global economy. First, the European Central Bank announced a program of unlimited buying of peripheral country debt under certain conditions. Their actions have temporarily put a floor on eurozone risk.
China followed by announcing a series of infrastructure spending initiatives designed to stimulate the economy. Measures include plans to build 2,018 kilometers of railroads, as well as spending on sewage treatment plants, port and warehouse projects and waterway upgrades.
And then last week the Federal Reserve joined the party by announcing further stimulus for the American economy.
Stock and commodity prices have soared on news of these pump priming measures. While our Trend Model was prescient enough to spot this rally early, we believe that this is a rally to be “rented and not owned”. Longer term problems remain and the global economy still has to deal with the longer term problem of a debt overhang, which ultimately translates to slower economic growth.
They went on to utilize a chart from HS Dent Research which adds to the the story. It demonstrated the correlation of US age demographics to stock market returns. Baby Boomers are nearing retirement and until the next generation, who are aptly named the Echo Boomers, start to hit their peak savings years, stock prices will continue to face some real headwinds. (I haven't included the chart in this blog entry, but instead have added a great chart showing the "expansion and contraction" cycles in the markets (Dow Jones back to 1900). One can easily spot the population "boomers" cycle from start to current retirement.)
Wednesday, July 18, 2012
Realized Canadian light crude prices have improved significantly; will the equities follow?
My friends at GMP recently reviewed the price trend of Canadian light crude, and the potential this will lead to upward momentum in the small/mid caps in this space.
The WTI price has strengthened in recent weeks but there have been wider CDN price differentials periodically throughout 2012 which have negatively impacted Canadian wellhead prices. We note that the light differentials have narrowed substantially in the last couple weeks results in significantly higher realized oil prices for producers.
· The graph shows that the Canadian light Sweet Price (Net Energy) was trading at a of discount to WTI of $11.50/b or a CDN realized price of ~$65.00/b in late June.
· The discount in the couple weeks has narrowed significantly from $11.50/b to only $1.00 - $3.25/b currently. This narrowing combined with the improvement in WTI has significantly improved the realized price in Canada. The implied CDN light price as of last night was ~$85.00/b a $20.00/b improvement in the last 2.5 weeks.
· This trend is also seen in other light crude products. For example, Bakken crude at Clearbrook MN has increased from US$63.69/b on June 28th to ~US$88.50/b this morning.
 The oil weighted equities have not reflected this realized price improvement
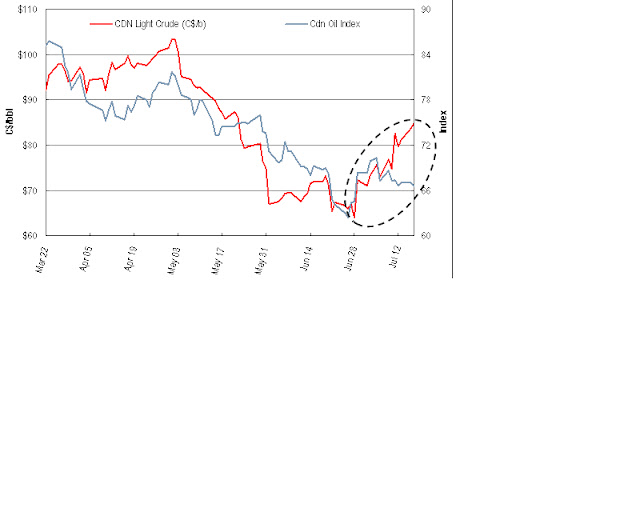
· No surprise but there is a strong correlation between the light crude price and oil weighted producers in our coverage universe. We have included a graph going back from March which shows that the two often move in lock step (corr. of 85%)
E
The WTI price has strengthened in recent weeks but there have been wider CDN price differentials periodically throughout 2012 which have negatively impacted Canadian wellhead prices. We note that the light differentials have narrowed substantially in the last couple weeks results in significantly higher realized oil prices for producers.
· The graph shows that the Canadian light Sweet Price (Net Energy) was trading at a of discount to WTI of $11.50/b or a CDN realized price of ~$65.00/b in late June.
· The discount in the couple weeks has narrowed significantly from $11.50/b to only $1.00 - $3.25/b currently. This narrowing combined with the improvement in WTI has significantly improved the realized price in Canada. The implied CDN light price as of last night was ~$85.00/b a $20.00/b improvement in the last 2.5 weeks.
· This trend is also seen in other light crude products. For example, Bakken crude at Clearbrook MN has increased from US$63.69/b on June 28th to ~US$88.50/b this morning.

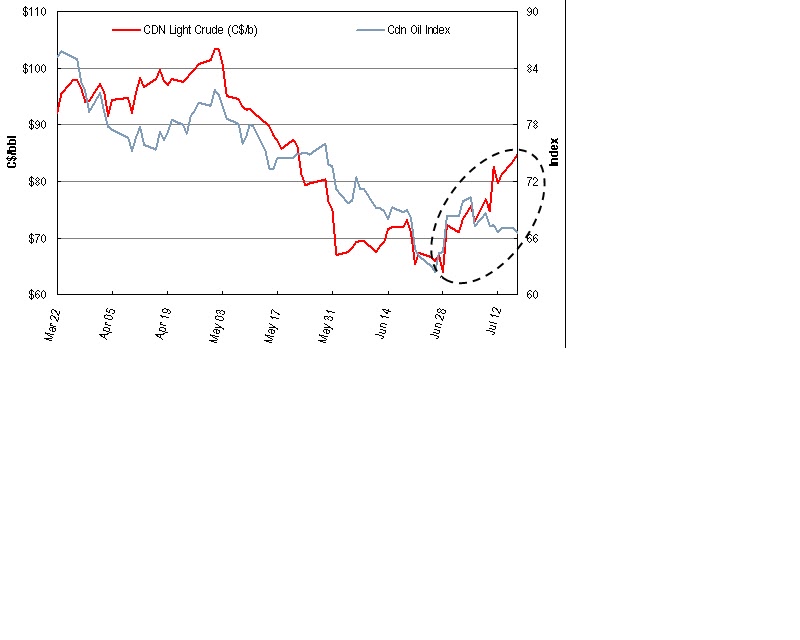
· No surprise but there is a strong correlation between the light crude price and oil weighted producers in our coverage universe. We have included a graph going back from March which shows that the two often move in lock step (corr. of 85%)
·
However, the recent strengthening in Canadian pricing has not been reflected in the share prices of the oil weighted producers and the relationship has diverged. The E&P’s that would benefit the most from the stronger pricing and sentiment would be the oil weighted producers.Cheers E
Wednesday, March 21, 2012

Tuesday, March 20, 2012
The Search for Yield - Dividends & Payout Ratios

In an era of historically low bond yields and zero percent benchmark interest rates,
the thirst for income has rarely been so hard to quench. Since 2009, the yield on 3-
month Treasury Bills has averaged 0.65% in Canada and 0.10% in the United
States. From 1954 to 2007, U.S. 3-month yields averaged 5.2%. Investors have
been fleeing pure equity investment vehicles for years and flocking to income
products/bond mutual funds in search of income and lower volatility. The latter is
likely to prove elusive in coming years as monetary policy normalizes higher. The
traditional high dividend paying sectors such as Utilities, Telecom, and REITs have
benefitted the most from income oriented flows in recent years, but other areas of
the market may now attract some attention. U.S. Banks that have cleared stresstests
will start raising dividends and Technology behemoth Apple announced
yesterday that it would re-introduce a dividend. The S&P 500 dividend currently
stands at US$27.53 and its dividend yield of 1.95% had until recently surpassed the
U.S. 10-Yr bond (2.38% yesterday, 1.88% last 3M average). In Canada, the TSX's
dividend yield (2.85%) still edges 10-Yr Canada bonds (2.29%). Both for the TSX
and S&P 500, a positive dividend yield-to-bond yield spread is a first since late
2008-early 2009. Dividend growth has lagged the profit recovery since 2009 and
the S&P 500's payout ratio of 28% is the lowest since 1871. Equity flows could see
a positive reversal if bond returns start to disappoint. Should this happen, we
believe companies offering high yields and the ability to raise dividends will benefit.
Non-traditional dividend areas are likely to join the dividend party as well. Our Chart
of the Day highlights the S&P 500 and TSX index/sector dividend yield and payout.
Subscribe to:
Posts (Atom)