Saturday, September 15, 2012

September (make it) Rain... (kinda sounds like a G&R song)

So here we are, half way through September, and the markets continue to show us that we like the feeling of quantitative easing... So much so, that all other equity indexes are showing the immensely positive shock these programs have on our psychological beings. So away we rally....

My friend over at Qwest Investment Management had a terrific "trend watch" report out last week. The following utilizes some excerpts from this letter which I think hit the nail on the head for the economic environment we are in...

September is turning out to be “stimulus month” for the global economy. First, the European Central Bank announced a program of unlimited buying of peripheral country debt under certain conditions. Their actions have temporarily put a floor on eurozone risk.

China followed by announcing a series of infrastructure spending initiatives designed to stimulate the economy. Measures include plans to build 2,018 kilometers of railroads, as well as spending on sewage treatment plants, port and warehouse projects and waterway upgrades.

And then last week the Federal Reserve joined the party by announcing further stimulus for the American economy.  
Stock and commodity prices have soared on news of these pump priming measures. While our Trend Model was prescient enough to spot this rally early, we believe that this is a rally to be “rented and not owned”. Longer term problems remain and the global economy still has to deal with the longer term problem of a debt overhang, which ultimately translates to slower economic growth.

They went on to utilize a chart from HS Dent Research which adds to the the story. It demonstrated the correlation of US age demographics to stock market returns. Baby Boomers are nearing retirement and until the next generation, who are aptly named the Echo Boomers, start to hit their peak savings years, stock prices will continue to face some real headwinds. (I haven't included the chart in this blog entry, but instead have added a great chart showing the "expansion and contraction" cycles in the markets (Dow Jones back to 1900). One can easily spot the population "boomers" cycle from start to current retirement.)      


 As this rally continues, look for opportunities to take profits off the table and reallocate towards uncorrelated asset classes. - For many of us who have been holding throughout the cycle, this may prove an excellent time to do so.   Best Regards and Safe Investing!   E

Wednesday, July 18, 2012

Realized Canadian light crude prices have improved significantly; will the equities follow?

My friends at GMP recently reviewed the price trend of Canadian light crude, and the potential this will lead to upward momentum in the small/mid caps in this space.

The WTI price has strengthened in recent weeks but there have been wider CDN price differentials periodically throughout 2012 which have negatively impacted Canadian wellhead prices. We note that the light differentials have narrowed substantially in the last couple weeks results in significantly higher realized oil prices for producers.


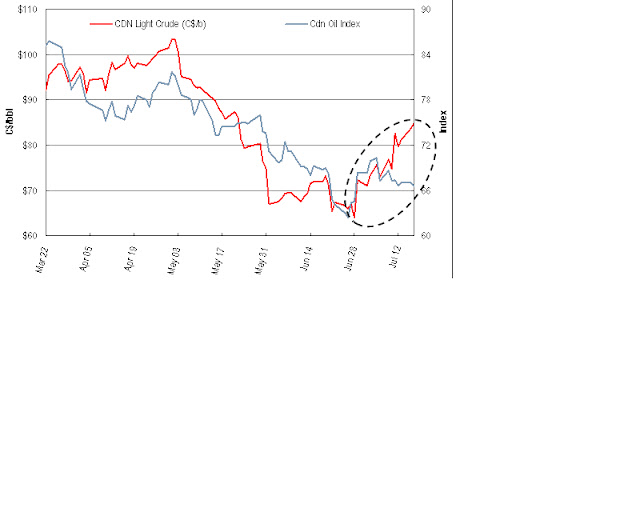
· The graph shows that the Canadian light Sweet Price (Net Energy) was trading at a of discount to WTI of $11.50/b or a CDN realized price of ~$65.00/b in late June.

· The discount in the couple weeks has narrowed significantly from $11.50/b to only $1.00 - $3.25/b currently. This narrowing combined with the improvement in WTI has significantly improved the realized price in Canada. The implied CDN light price as of last night was ~$85.00/b a $20.00/b improvement in the last 2.5 weeks.

· This trend is also seen in other light crude products. For example, Bakken crude at Clearbrook MN has increased from US$63.69/b on June 28th to ~US$88.50/b this morning.
 
The oil weighted equities have not reflected this realized price improvement


· No surprise but there is a strong correlation between the light crude price and oil weighted producers in our coverage universe. We have included a graph going back from March which shows that the two often move in lock step (corr. of 85%)
 
 
·
However, the recent strengthening in Canadian pricing has not been reflected in the share prices of the oil weighted producers and the relationship has diverged. The E&P’s that would benefit the most from the stronger pricing and sentiment would be the oil weighted producers.Cheers
 
E

Tuesday, March 20, 2012

The Search for Yield - Dividends & Payout Ratios


In an era of historically low bond yields and zero percent benchmark interest rates,
the thirst for income has rarely been so hard to quench. Since 2009, the yield on 3-
month Treasury Bills has averaged 0.65% in Canada and 0.10% in the United
States. From 1954 to 2007, U.S. 3-month yields averaged 5.2%. Investors have
been fleeing pure equity investment vehicles for years and flocking to income
products/bond mutual funds in search of income and lower volatility. The latter is
likely to prove elusive in coming years as monetary policy normalizes higher. The
traditional high dividend paying sectors such as Utilities, Telecom, and REITs have
benefitted the most from income oriented flows in recent years, but other areas of
the market may now attract some attention. U.S. Banks that have cleared stresstests
will start raising dividends and Technology behemoth Apple announced
yesterday that it would re-introduce a dividend. The S&P 500 dividend currently
stands at US$27.53 and its dividend yield of 1.95% had until recently surpassed the
U.S. 10-Yr bond (2.38% yesterday, 1.88% last 3M average). In Canada, the TSX's
dividend yield (2.85%) still edges 10-Yr Canada bonds (2.29%). Both for the TSX
and S&P 500, a positive dividend yield-to-bond yield spread is a first since late
2008-early 2009. Dividend growth has lagged the profit recovery since 2009 and
the S&P 500's payout ratio of 28% is the lowest since 1871. Equity flows could see
a positive reversal if bond returns start to disappoint. Should this happen, we
believe companies offering high yields and the ability to raise dividends will benefit.
Non-traditional dividend areas are likely to join the dividend party as well. Our Chart
of the Day highlights the S&P 500 and TSX index/sector dividend yield and payout.

Thursday, February 16, 2012

Strategy Corner....Dividends and Share Buy Backs. (It's been a while)

Keeping in line with our strategy to look for new and innovative investment ideas, I bring you the following:

Dividends and Share Buybacks

Over the years, companies have created shareholder value through share repurchase programs and/or dividend increases. By share repurchase program we are referring to companies that buy back their stock in the open market. Both policies can create value for shareholders although there is an ongoing debate as to how much value is created, and which is the better use of free cash flow.

Certainly, the permanence of a dividend increase tends to be a better indicator of financial health and investors like to see dividends credited to their accounts. That said the return of cash to shareholders through share repurchase programs also benefits shareholders by reducing the number of shares outstanding, boosting earnings per share, and providing support for the share price. In this report, we have attempted to identify companies that have a history of consistently delivering on both shareholder friendly policies.

U.S. Corporations Flush with Cash

U.S corporations are sitting on record levels of cash with non-financial corporate businesses holding U$2.12 trillion in liquid assets at the end of the third quarter of 2011. High free cash flow yields combined with low returns generated on cash holdings should lead to increased dividend payments to shareholders and share buyback activity. In 2011, S&P 500 companies paid U$256 billion in dividends to shareholders, or about 29% of earnings. That’s well below the long-term average payout ratio of 47%. In 2011, U$530 billion worth of share buybacks were also authorized, up nearly 45% from 2010.

16 Companies with Investors’ Interests in Mind

We screened the S&P 100 Index of U.S. mega cap stocks, looking for companies that consistently repurchased shares and increased dividends over the past five years. To qualify, a company must have repurchased and reduced its common shares outstanding, and increased its dividend in each of the last five years without exception.

When creating our list, why did we not simply look for cash-rich companies with high free cash flow yields? Far too many management teams have destroyed shareholder value with poor investment decisions. Share buybacks and dividends put cash directly back into shareholders hands. However, these shareholder friendly policies should not come at the expense of strategic investments that could positively impact a company’s long-term growth and financial health.

There are 16 companies in the S&P 100 that met our selection criteria. Industrials, in particular defense companies, large retailers, and health care companies dominate the list. The stocks on the following page are ranked based on yield, decline in shares outstanding, and growth rate in dividends. On the basis of these three equally-weighted factors, Lockheed Martin (LMT) tops the list. On average, over the last five years, this defense company has reduced its shares outstanding by 5.3% per year while increasing its dividend annually by an impressive 21%. The shares currently yield 4.8%. Runner-up Texas Instruments (TXN) repurchased a similar amount of shares, but its Board was more aggressive in terms of annual dividend increases. However, the chipmaker’s shares yield only 2.1% at their recent quotation.

*Call or send me an email to discuss the companies that passed the test, and how this strategy may be a possible addition to your current investment policy.

Best Regards and Safe Investing!

E